Term Project --- GIS in
Water Resources
Delineation of Sub-watersheds and
Comparison of Streamflow Data and Precipitation Data in the Big Lost River
basin, ID
By Hongxing Zheng
hzheng@cc.usu.edu
Fall, 2001
~~~~~~~~~~~~~~~~~~~~~~~~~~~~~~~~~~~~~~~~~~~~~~~~~~~~~~~~
Table of Contents
1.
Background
2.
Objective
3.
Study area
4.
Data sources
5.
Processing
6.
Conclusion
7. Further
work
8. Problems
9. Acknowledgement
1. Background
The
A
distinctive feature of the
2. Objective
1.
Delineate the sub watersheds in the
2.
Compare the precipitation data and streamflow data of
adjacent weather station and gauging station, and the streamflow value of
upstream and downstream gauging stations to show why
3. Study Area
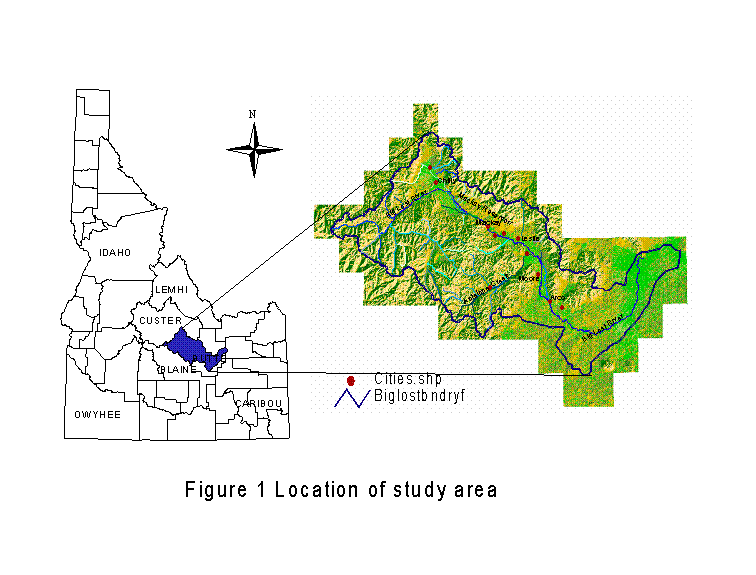
Figure 1 shows the location of the Big Lost River basin in Idaho state, most of the basin are located in Butte county and Custer county.
4. Data sources
· DEM (Digital Elevation Model) : ftp://geolibrary.uidaho.edu/Data/DEM/
·
Big
· Location of streamflow gauging stations and the streamflow data:
http://idaho.usgs.gov/rt-cgi/gen_tbl_pg
· Location of weather stations and the precipitation data:
http://www.wrcc.dri.edu/summary/climsmid.html
· River: http://www.idwr.state.id.us/gisdata/gis.htm
5. Processing
From
the USGS website, the locations of the streamflow gauging stations in the
Table 1 Locations of gaging stations
|
GAUG_NO |
NAME |
LONG |
LAT |
|
13120000 |
NF BIG
LOST RIVER AT WIL |
114°06'47" |
43°55'59" |
|
13120500 |
BIG LOST
RIVER AT HOWELL |
114°01'12" |
43°59'54" |
|
13127000 |
BIG LOST
RIVER BL MACKAY |
113°40'28" |
43°57'05" |
|
13132500 |
BIG LOST
RIVER NR ARCO I |
113°16'10" |
43°35'00" |
|
13132513 |
INEL
DIVERSION AT HEAD N |
113°05'00" |
43°30'50" |
|
13132520 |
BIG LOST
RIVER BL INEL D |
113°04'52" |
43°30'57" |
|
13132535 |
BIG LOST
R AT |
112°56'33" |
43°34'26" |
|
13132565 |
BIG LOST
RIVER AB BIG LO |
112°52'20" |
43°43'40" |
Table 2 Locations of weather stations
|
STATION
NAME |
LONG |
LAT |
|
ARCO 3 SW |
113°20' |
43°36' |
|
CHILLY
BARTON FLAT |
113°49' |
43°59' |
|
GROUSE |
113°37' |
43°42' |
|
MACKAY RANGER
STATION |
113°37' |
43°55' |
|
|
113°57' |
43°32' |
Steps of making the point shape files:
1. Converting the coordinates of the stations into decimal degrees using Excel and saving the file as DBF file
Decimal degree = degrees + minutes / 60 + seconds / 3600
2. In ArcMap, add the DBF table created in Excel. Right click on the table and select Display XY Data…, and after some process, the table should be transferred to an Event. An event is a point or line that is displayed using coordinates, but it is not shape file or feature class.
3. Right click on the Event layer and press Data/Export… to export the data as a shape file.
Figure 2 shows the two point shape files in the same view.
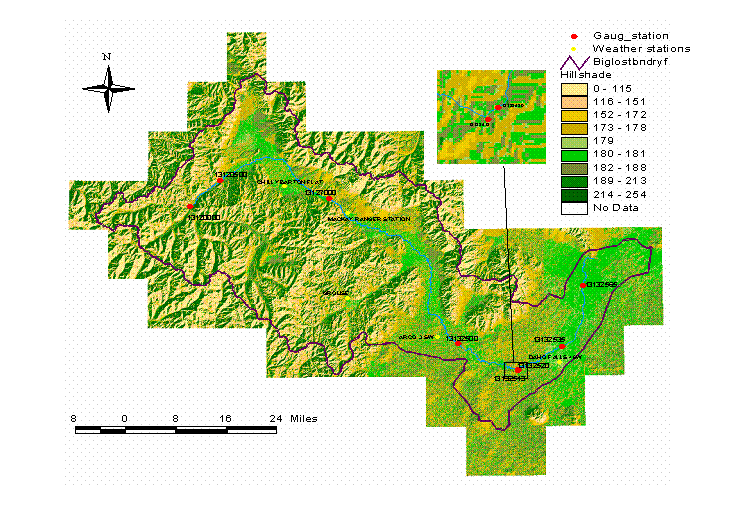
Figure 2
Table 3 and Figure 3 show the long time average monthly streamflow at the gaging stations in the basin, and table 4 and Figure4 show the precipitation data.
Table 3 Long time average monthly streamflow (cfs)
|
GAUG_NO |
JAN |
FEB |
MAR |
APR |
MAY |
JUN |
JUL |
AUG |
SEP |
OCT |
NOV |
DEC |
|
13120000 |
24.4 |
21.9 |
22.7 |
62.5 |
280 |
420 |
202 |
72.7 |
47.6 |
38.8 |
31.8 |
26 |
|
13120500 |
82.9 |
78 |
81.6 |
185 |
770 |
1,217 |
600 |
221 |
146 |
126 |
107 |
87.8 |
|
13127000 |
123 |
130 |
148 |
160 |
483 |
958 |
680 |
416 |
230 |
170 |
107 |
112 |
|
13132500 |
61.9 |
64.5 |
86.5 |
99 |
135 |
260 |
146 |
50.5 |
72.5 |
82.3 |
89 |
76 |
|
13132513 |
13.6 |
4.67 |
9.12 |
14.5 |
8.42 |
109 |
30.2 |
24.6 |
20.2 |
16.1 |
20.3 |
21.6 |
|
13132520 |
12.7 |
17.7 |
36 |
50.1 |
64.6 |
136 |
55.1 |
15.5 |
39.6 |
41.2 |
29.6 |
12.9 |
|
13132535 |
2.09 |
4.5 |
21.4 |
40.6 |
56.3 |
121 |
50.7 |
10.7 |
32 |
34 |
24.8 |
6.61 |
|
13132565 |
0.72 |
6.69 |
49.6 |
58.2 |
94.7 |
240 |
74.8 |
5.63 |
4.09 |
28 |
47.2 |
9.53 |
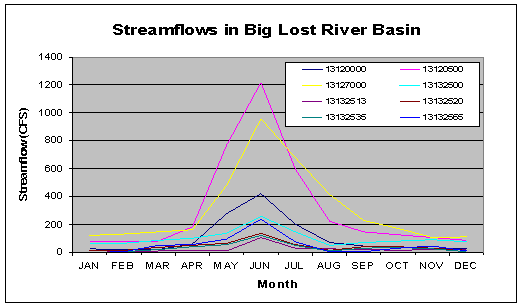
Figure 3
Table 4 Long time average precipitation (inches)
|
WEATHER
STATION |
JAN |
FEB |
MAR |
APR |
MAY |
JUN |
JUL |
AUG |
SEP |
OCT |
NOV |
DEC |
|
ARCO 3 SW |
0.93 |
0.91 |
0.70 |
0.74 |
1.24 |
1.19 |
0.61 |
0.69 |
0.65 |
0.50 |
0.70 |
0.91 |
|
CHILLY
BARTON FLAT |
0.37 |
0.28 |
0.45 |
0.63 |
1.31 |
1.34 |
0.94 |
0.85 |
0.76 |
0.53 |
0.42 |
0.39 |
|
GROUSE |
1.21 |
1.05 |
1.00 |
0.95 |
1.54 |
1.57 |
0.85 |
0.92 |
0.79 |
0.65 |
0.99 |
1.24 |
|
MACKAY
RANGER STATION |
0.79 |
0.63 |
0.63 |
0.64 |
1.09 |
1.35 |
0.93 |
0.82 |
0.69 |
0.56 |
0.60 |
0.75 |
|
|
0.71 |
0.63 |
0.61 |
0.79 |
1.28 |
1.27 |
0.52 |
0.50 |
0.69 |
0.51 |
0.68 |
0.72 |
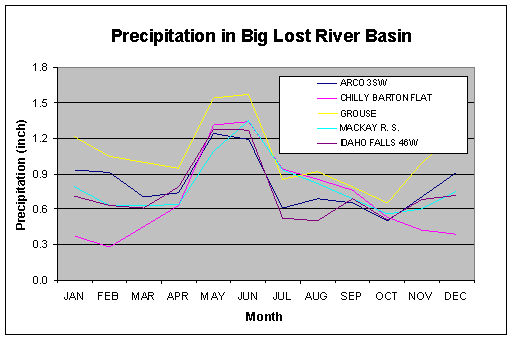
Figure 4
In order to compare the streamflow and precipitation, the unit of the streamflow data should be converted from CFS to inch. To do that, the drainage area of gaging station should be known.
First, the sub watersheds taking the gaging station as outlet are delineated.
Steps delineating the sub watersheds:
1. Using ArcInfo Workstation functions to fill the pits in the DEM data, i.e. remove the sinks.
2.
Add the Hydrology
modeling toolbar to ArcMap. It looks like this 
3. Calculate the flow direction grid.
4. Calculate the flow accumulation grid.
5.
Select Hydrology
Modeling Toolbar/Hydrology/Properties.... Set the inputs flow
direction as flow direction grid calculated and flow accumulation as flow
accumulation grid calculated. This will enable the Watershed ![]() and
Raindrop
and
Raindrop ![]() buttons on the Hydrology Modeling Toolbar. Now the Hydrology modeling
toolbar should look like this.
buttons on the Hydrology Modeling Toolbar. Now the Hydrology modeling
toolbar should look like this. 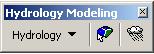
6.
Click the Watershed ![]() button
and in the DEM view, click at the gaging station point, the watershed of that
station should appear on the screen. Do the same thing for the other gaging
stations.
button
and in the DEM view, click at the gaging station point, the watershed of that
station should appear on the screen. Do the same thing for the other gaging
stations.
Figure 5 shows the sub watersheds delineated. (For some unknown reason, the sub watershed for gaging station 13132535 can not be got)
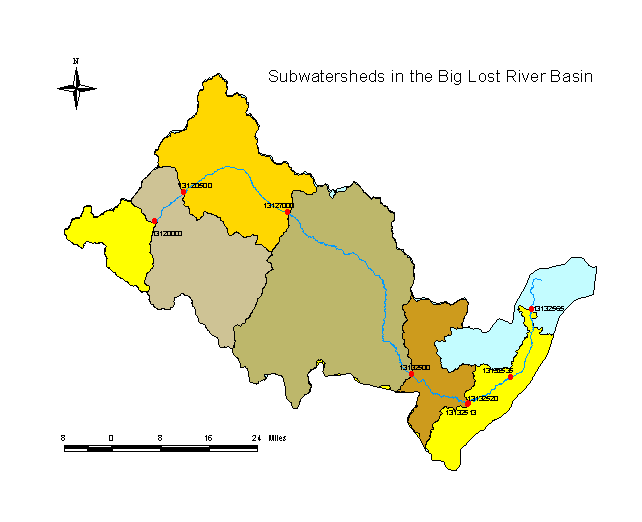
Figure 5
Second, create a new geodatabase and then import the watersheds into a new feature dataset in that geodatabase. The areas of the sub watersheds are determined as a part of the import process, and the values are shown in table 5 in square miles.
After getting the drainage area of the gaging stations, the unit of the streamflow data can be converted into inch by using the following equation.
![]()
Table 5 Long time average streamflow (inches)
|
GAUG_NO |
DRNAREA |
JAN |
FEB |
MAR |
APR |
MAY |
JUN |
JUL |
AUG |
SEP |
OCT |
NOV |
DEC |
|
13120000 |
114 |
0.25 |
0.20 |
0.23 |
0.61 |
2.83 |
4.11 |
2.04 |
0.74 |
0.47 |
0.39 |
0.31 |
0.26 |
|
13120500 |
450 |
0.21 |
0.18 |
0.21 |
0.46 |
1.97 |
3.02 |
1.54 |
0.57 |
0.36 |
0.32 |
0.27 |
0.22 |
|
13127000 |
803 |
0.18 |
0.17 |
0.21 |
0.22 |
0.69 |
1.33 |
0.98 |
0.60 |
0.32 |
0.24 |
0.15 |
0.16 |
|
13132500 |
1410 |
0.05 |
0.05 |
0.07 |
0.08 |
0.11 |
0.21 |
0.12 |
0.04 |
0.06 |
0.07 |
0.07 |
0.06 |
|
13132513 |
1750 |
0.01 |
0.00 |
0.01 |
0.01 |
0.01 |
0.07 |
0.02 |
0.02 |
0.01 |
0.01 |
0.01 |
0.01 |
|
13132520 |
1751 |
0.01 |
0.01 |
0.02 |
0.03 |
0.04 |
0.09 |
0.04 |
0.01 |
0.03 |
0.03 |
0.02 |
0.01 |
|
13132535 |
1925 |
0.00 |
0.00 |
0.01 |
0.02 |
0.03 |
0.07 |
0.03 |
0.01 |
0.02 |
0.02 |
0.01 |
0.00 |
|
13132565 |
2059 |
0.00 |
0.00 |
0.03 |
0.03 |
0.05 |
0.13 |
0.04 |
0.00 |
0.00 |
0.02 |
0.03 |
0.01 |
From
Figure 2, the relative location of the gaging stations and weather stations,
the streamflow difference between station 13120500 and 13127000 can be compared
with the precipitation of weather station Chilly Barton Flat. But because
station 13127000 is just below the Mackay Dam, its streamflow is completely
regulated by the Mackay Reservoir; it is meaningless to compare the streamflow
between it and the upstream gaging station.
The streamflow difference between gaging station 13127000 and 13132500
can be compared with the average precipitation of the 3 weather stations,
Mackay Ranger Station, Grouse and Arco 3SW, because these 3 weather
stations are all located between gaging
station 131270000 and 13132500. Also, the streamflow difference between
13132520 and 13132535 can be compared with the precipitation of weather station
From Figure 6 and Figure 7, it can be seen that the downstream gaging station 13132520 and 13132535 has smaller streamflow value than that of upstream gaging station 13127000 and 13132535 respectively. But normally, if there is no flow loss or there is normal flow loss, the downstream point should have higher streamflow than upstream point. When comparing the streamflow of gaging station between 13120000 and 13120500 (Figure 8) and between 13132500 and 13132513 (Figure 9), it also shows that the downstream gaging station has smaller streamflow value.
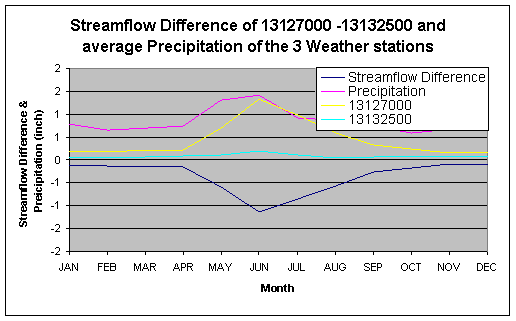
Figure 6
![]()
![]()
![]()
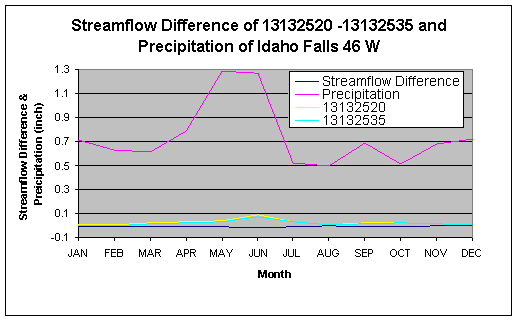
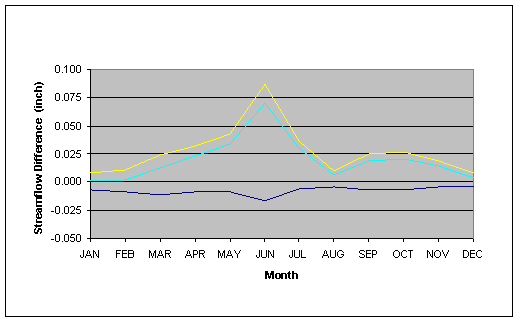
Figure 7
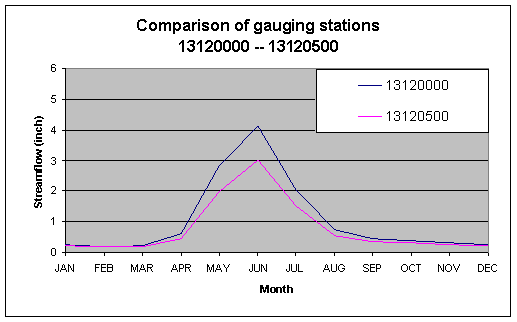
Figure 8
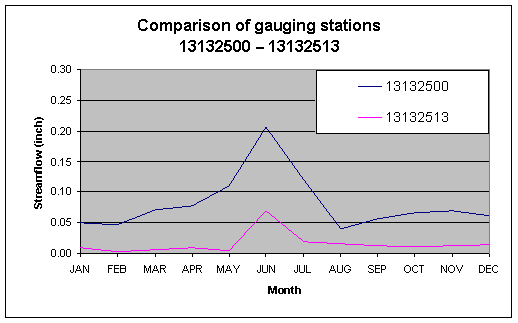
Figure
9
6. Conclusion
Big
7. Further work
•
Analysis of the geohydrologic condition of the
basin.
•
The interchange of surface water and ground
water in the area.
8.
Problems
· For some unknown reason, the sub watershed for gauging station 13132535 can not be delineated.
· Because the river is a losing stream, downstream gaging station always has a larger discharge than that of upstream stations, the relation between precipitation and streamflow is not very clear so that the fraction of precipitation that becomes streamflow can not be determined.
9.
Acknowledgement
· Dr. David Tarboton, Civil & Environmental Engineering, USU
· Ahmed Said, Civil & Environmental Engineering, USU